Anticipate Demand
Explore customer journey insights
Stay Competitive
Leverage key competitor data
Identify Gaps
Conduct product-level data analysis
Track Emerging Trends
Analyze billions of consumer searches
Future-proof Success
Accurately forecast product performance
Measure the impact of AI-powered product discoverability
Track the metrics that matter most with easy-to-use dashboards.
ROI Impact
Search Queries
ROI Paths
SEO Keyword
Product Performance
Gain a competitive edge with unparalleled catalog intelligence
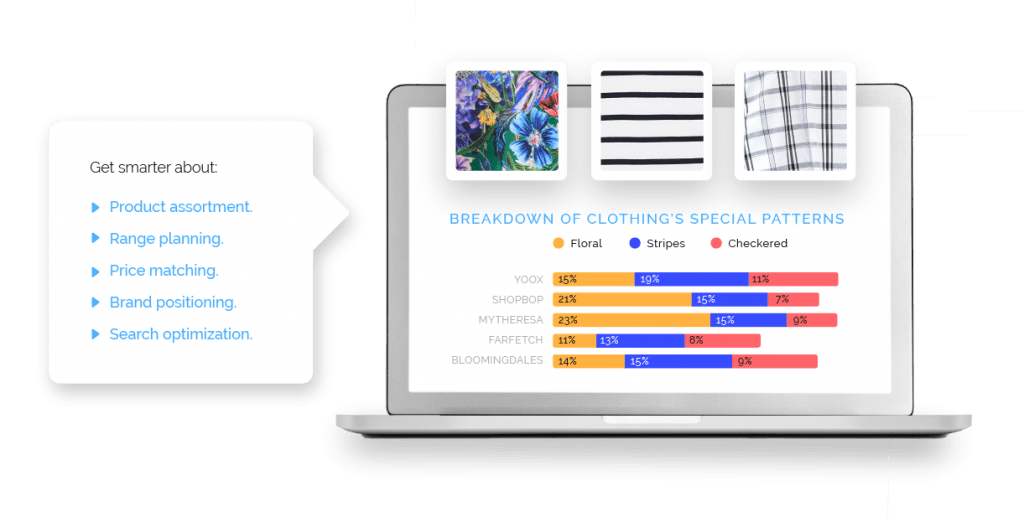
Together, Smart Data and Catalog Manager enable you to conduct side-by-side comparisons with your competitors’ product catalogs. Uncover competitive intelligence you’ve never had access to before.


Monitor and enhance the customer journey
Learn how customers interact with your brand — from the products they discover in search to the suggested styles they see along the way. Utilize detailed customer insights to inspire best-in-class UX.
- Understand customer behaviors using Smart Search.
- See how shoppers engage with Smart Recommendations.
- Measure the performance of Smart Ads.


